EATING THE APPROACH FROM CONNECTOMICS

EATING THE APPROACH FROM CONNECTOMICS
Azucena Jurado. Student of the Degree in Biotechnology
ABSTRACT
The activity of eating so far has three stages in which they are divided into: a) the cefalic phase b) the gastric phase and the intestinal phase; all three are regulated by neural activities. Likewise, there is documentation about the relationship between the brain areas activated at certain meal times. A database was made using the Braintome Atlas catalog, to evaluate the documented areas and the previously documented areas that are activated with three selected categories: a) Eating drinking, b) Perception gustation, c) Chewing / swallowing were selected. With these data, a matrix and a connectogram were elaborated, obtaining many of the documented connections, both theoretical and in the Braintome Atlas catalogue.
Introduction
The activity of eating so far has three stages in which it is divided, the cephalic phase, the gastric phase and the intestinal phase. During the cephalic phase of digestion, the smell. The initial sight, thought, or taste of food activates neuronal centers in the cerebral cortex, the hypothalamus, and the brain center.
The brainstem activates the facial (VII), glossopharyngeal (IX) and vagus (X) nerves. The fasial and glossopharyngeal nerves stimulate the secretion of saliva by the alivary glands, while the vagus nerve stimulates the gastric glands to produce gastric juice. The purpose of the cephalic phase of digestion is to prepare the mouth and stomach to receive the food that is to be ingested. The gastric phase and the intestinal phase have neural and hormonal regulation.
In the gastric phase, there are two receptors: the chemoreceptors, these are sensitive to the PH of the gastric quimo, and the gastric stretch receptors; When both receptors are activated, nerve impulses are sent to the submucosal plexus, where parasympathetic and enteric neurons are activated. These waves cause peristalsis and continue to stimulate the outflow of gastric acid. The intestinal phase is when food reaches the small intestine, there are inhibitory effects that slow the output of quimo from the stomach, this distension. It causes the enterogastric reflex, the receptors in charge send nerve impulses to the medulla oblongata where they inhibit parasympathetic stimulation and stimulate the sympathetic nerves of the stomach, thus inhibiting gastric motility and starting the contraction of the pyloric sphincter.
It is also important to analyze the functions that are registered in the areas of the brain in relation to eating. The hypothalamus is related to the control of appetite and satiety, there are receptor connections that send signals of hunger and satiety. Insular cortex one of its previously associated functions is the evaluation of the internal sensations of the body and is involved in the perception of taste and texture of food and is related to the feeling of satiety. With the background seen, a search was made in the Braintome Atlas catalogue; a conceptual map where the search for information and the information contained in the Braintom Atlas catalog were evaluated, and a connectagram was made with R studio based on the aforementioned relationships.
Method
1. It was previously documented about the functions of the brain area and connectomics.
2. The activity of eating was chosen to search for information in the Braintome Atlas database.
3. Through the Braintome Atlas, the areas of the brain that were activated when the activity was carried out were recorded.
4. Through the option of the connectogram, we began to analyze which of the selected areas were related. The categories of a) Eating drinking, b) Perception gustation, c) Chewing / swallowing were selected.
5. With the data collected, the list of active areas was recorded in a table and the matrix was prepared.
6. R Studio was used to make the relationship of brain functions.
7. Ran separate crypt to analyze trend measures.
Results
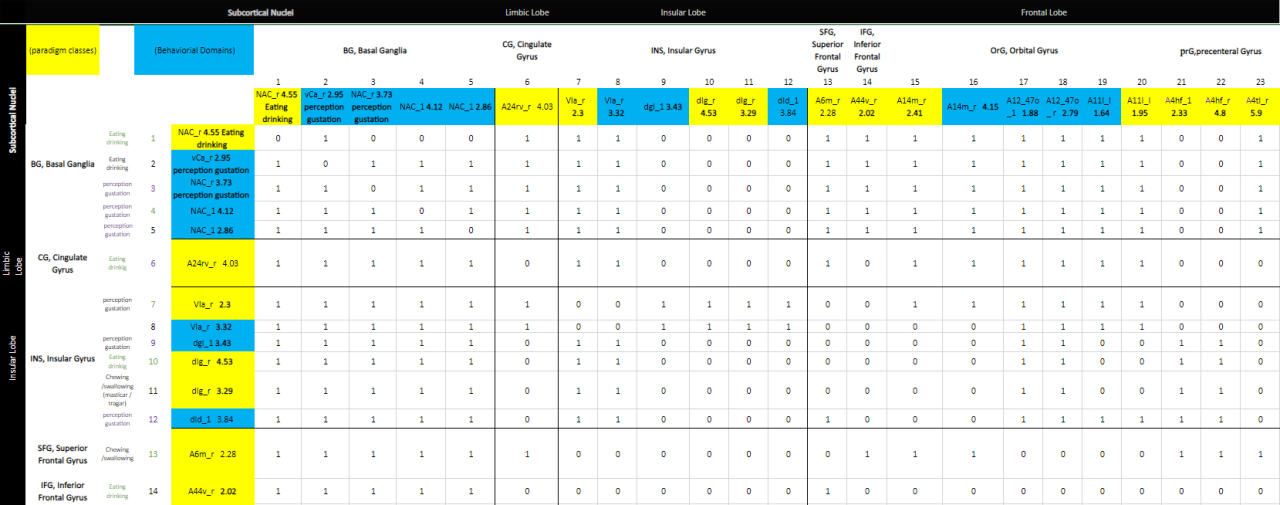
figure 1: conceptual map of feeding phases related to the activated areas recorded by the Braintome Atlas database
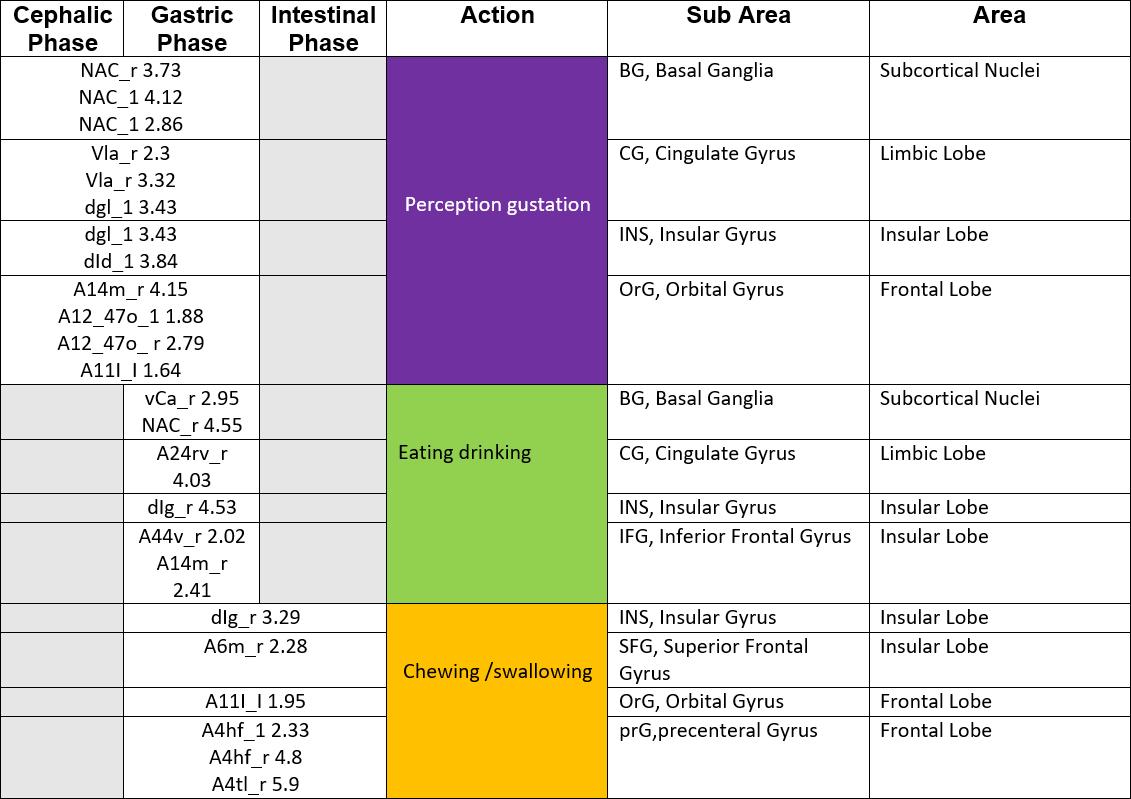
Braintome Atlas database. It can be observed that in the action of ¨Perception gustation¨ it belongs to the cephalic phase and the gastric phase and all the areas registered by Braintome Atlas (Subcortical Nuclei, Limbic Lobe, Insular Lobe, Frontal Lobe) are involved. In the gastric phase, it is observed that the frontal area does not act, there are only three areas that are activated: Subcortical Nuclei, Limbic Lobe, Insular Lobe.
In the action of “Chewing / swallowing” it is the one in which there is less registered in the Brainetome Atlas database, only the Frontal Lobe and Insular Lobe have been registered.
figure 2: Communities
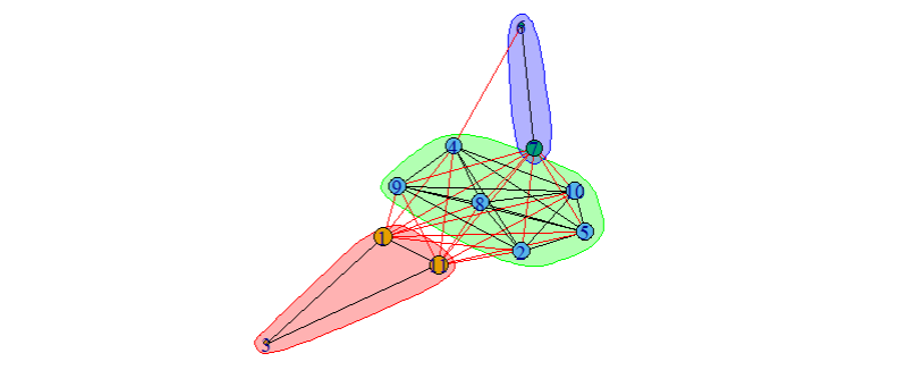
This figure of nodes shows us that they form three communities, there are ways that separate three hemispheres, central, right and left hemisphere. It can be seen that in the extreme hemispheres there are few nodes.
figure 3: Adjacency
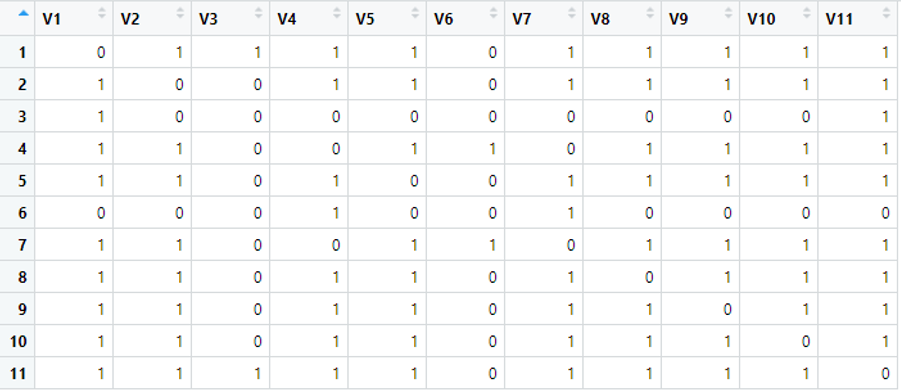
In the Braintome Atlas catalogue, the connectogram covers subareas in general, but does not cover subareas of subareas, so the matrix is 11 x 11.
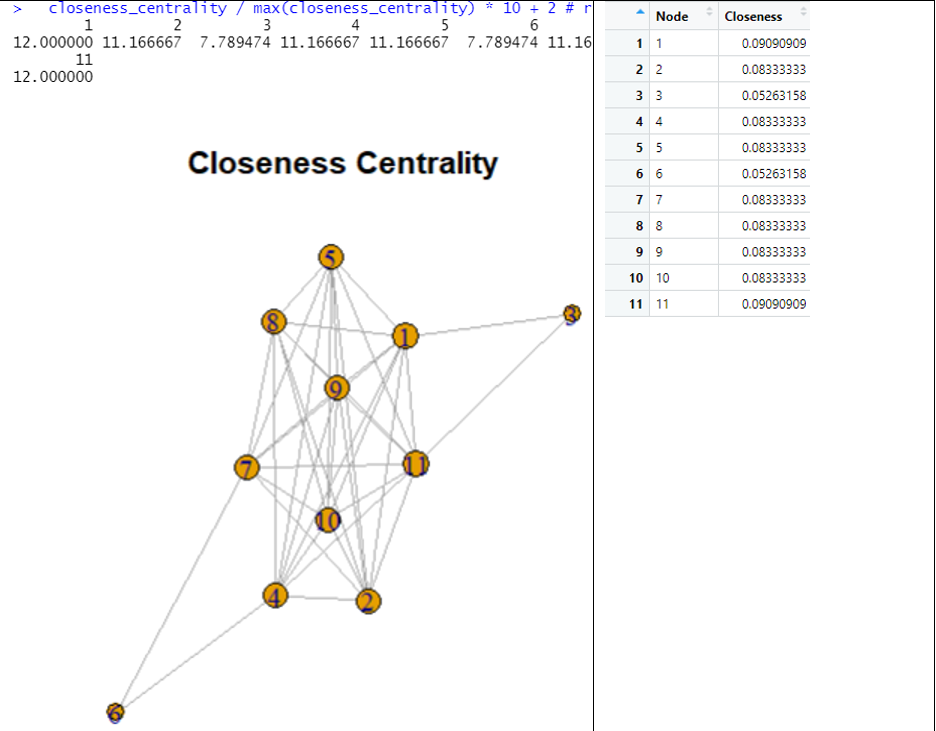
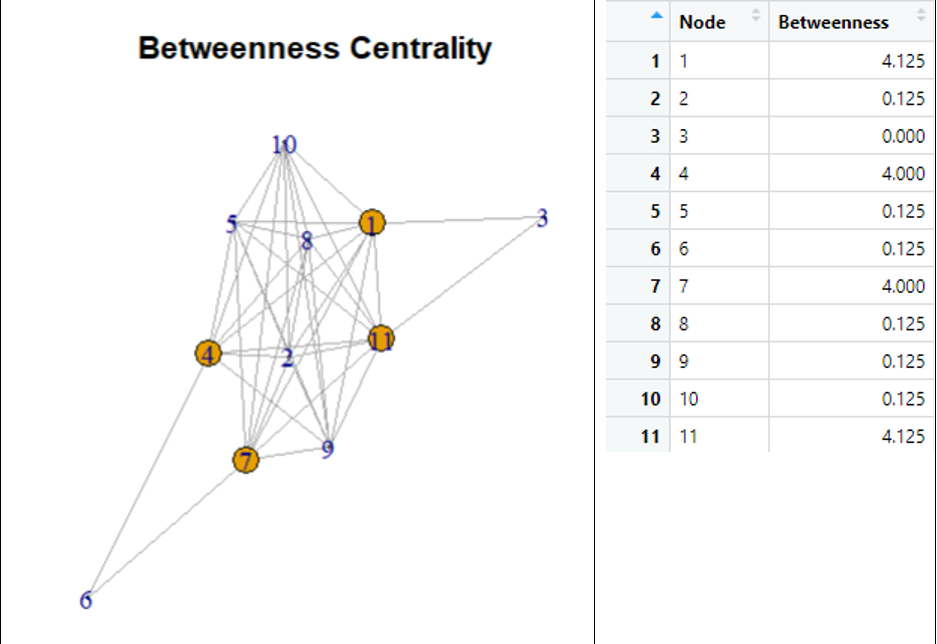
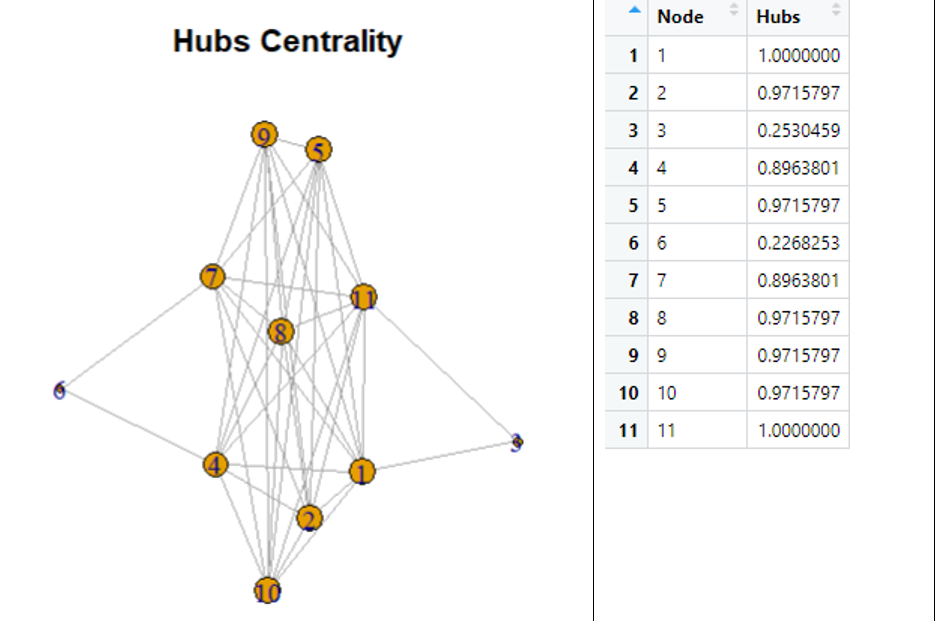
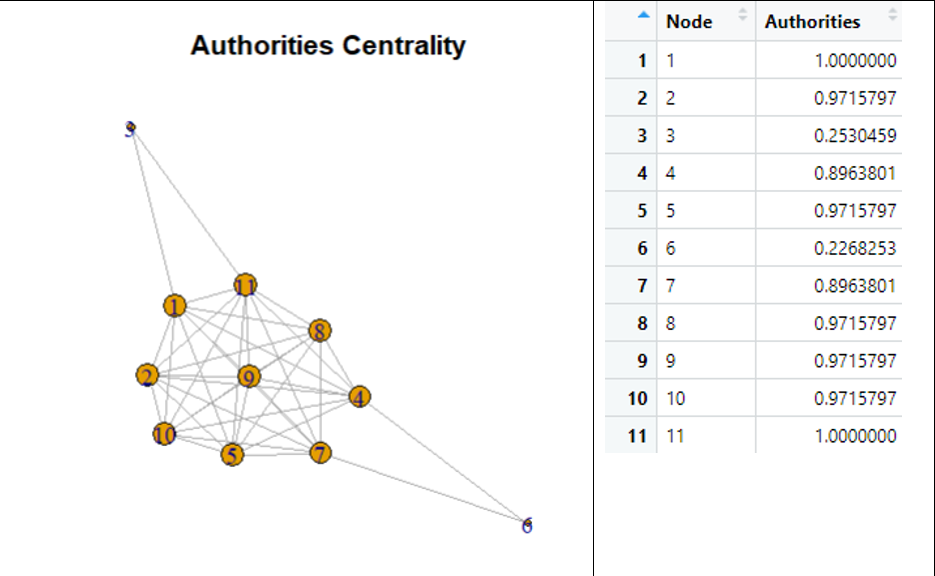
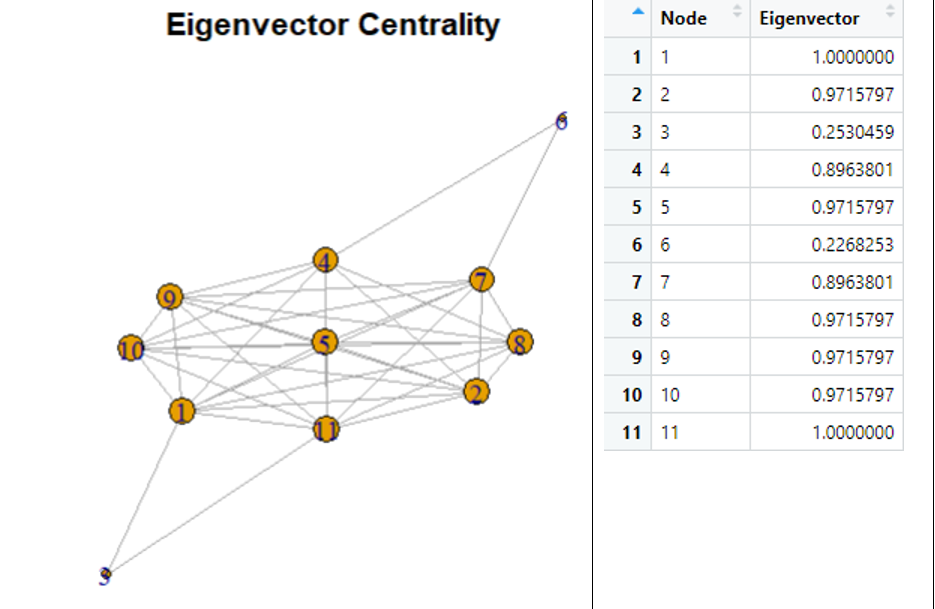
Figure 4: Central measures a) Degree of centrality, b) closeness centrality, c) Betweenness centrality d) Hubs centrality, e) Authorities centrality, f) eigenvector Centrality
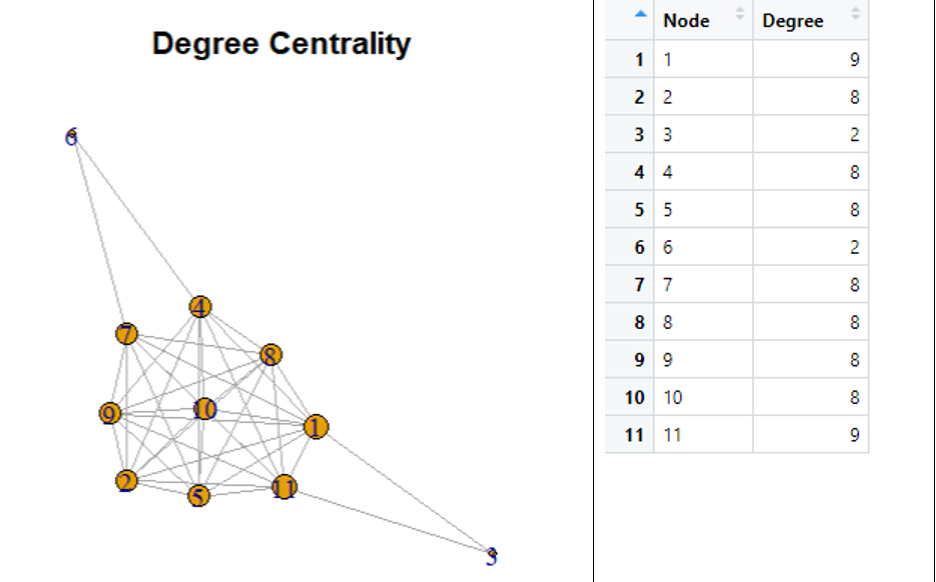
- a) Degree of centrality: it is a measure of centrality that quantifies the frequency or the number of times that a node is between the geodesics or shortest paths of other actors. It can be seen that with the exception of node 6 and node 3, the other nodes interact with values of 8 and 9, with node 10 being the central node.
- b) Closeness of centrality: is a measure that indicates the closeness centrality, it can be seen that both node 9 and 10 are the closest ones.
- c) Betweenness centrality: betweenness is a measure of centrality that quantifies the frequency or number of times a node is found. You can see the nodes, 1, 4, 11, 7 as the most prominent.
- d) Hubs centrality: is a measure that accounts for the quantity and quality of a node’s connections.
- e) Authorities centrality: it can be seen that only node 3 and 6 have no connection.
- f) Eigenvector centrality: measures the eigenvector centrality, it can be seen that node 6 and 3 are distant from the central values.
Figure 5: Summary table and values
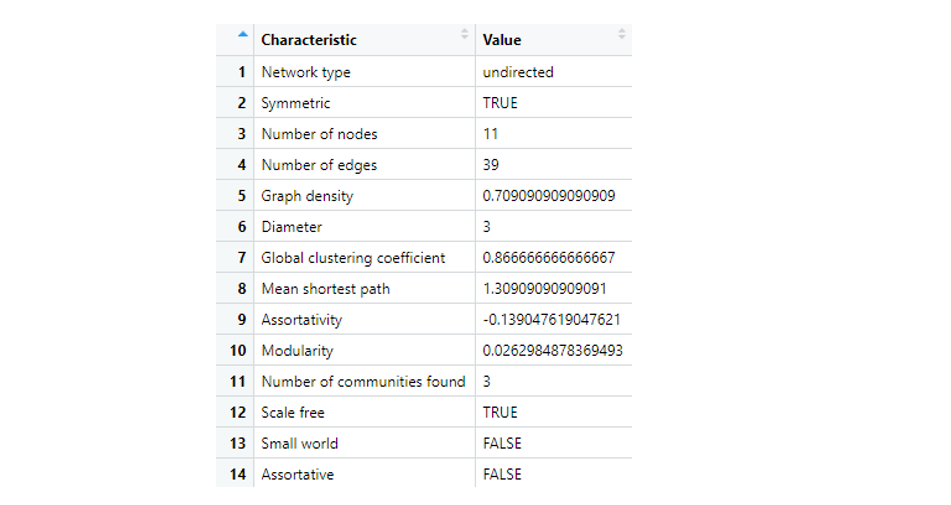
In the R Studio option, these windows are shown where they indicate the characteristic of the connectogram.
Discussion of results
(Harris, 2017) points out that the prefrontal cortex has been linked to decision making and planning. As well as the preparatory impulses in response to food. The associated pairs would be expected to be the same as those previously associated with the cephalic stage
It is known that in the gastric phase there are two receptors: the chemoreceptors that are sensitive to the quimo pH and the gastric stretch receptors; Both receptors, when activated, send nerve impulses to the submucosal plexus, where parasympathetic and enteric neurons are activated. These waves cause peristalsis and continue to stimulate gastric acid output, so it would be expected that all areas related to c) Chewing / swallowing and most of a) Eating drinking, are related in the database to the parasympathetic system.
The hypothalamus is related to the control of appetite and satiety, there are receptor connections that send signals of hunger and satiety, it is also expected that most or all of the selected pairs of category a) Eating drinking, are activated in this area.
The areas involved in the act of eating were analyzed. the three phases of digestion were known and associated. Programming in R was used to be able to associate a biological phenomenon.
Acknowledgment
A thank you to Doctor Ricardo Lara, for his effort in teaching us to use technology as part of the learning and study of Biophysics.
Bibliografía
Brainnetome Center, Institute of Automation. Connectogram [Internet]. BraintomeAtlas. 2014 [citado el 7 de junio de 2023]. Disponible en: https://atlas.brainnetome.org/
Tortota GJ, Derrickson B. Principios de Anatomía y Fisiología. Madrid, España: Editorial médica panamericana; 2015.
Annexes
1. Adjacency
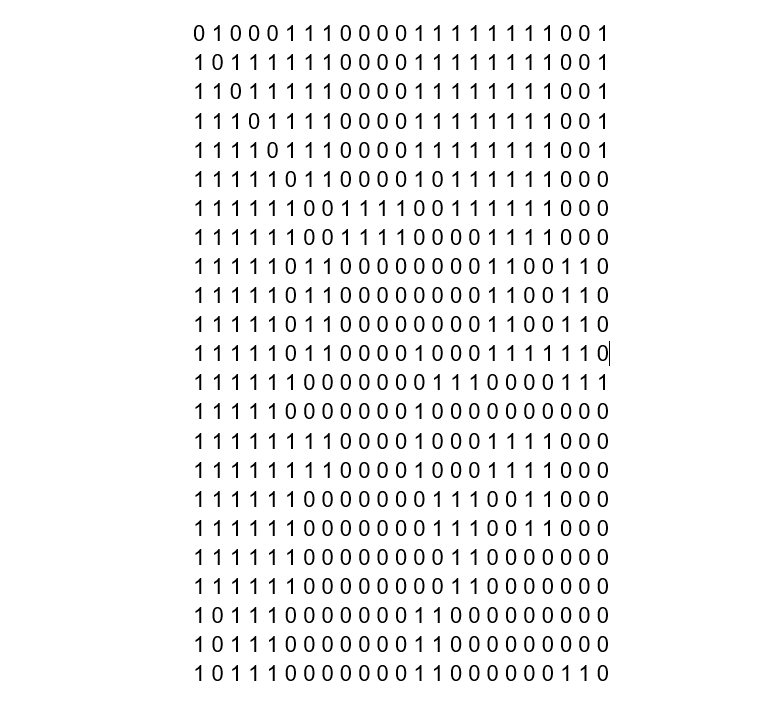
2. Matrix